Shortly after I joined the World Bank in 2003, I became part of a team working on road safety. It has been one of the highlights of my time at the Bank to have been able to address road safety, both on my projects and through supporting the Bank’s broader road safety agenda. Recently, I have helped lead the effort to prepare the guidance for how the Bank will expand and deepen its road safety efforts as we adopt road safety as a ‘safeguard’. This elevates road safety to be equivalent to other key development issues, such as environmental and social issues. This is a very long post which tries to summarize about a year’s worth of work by myself and the team!
Road Safety as a Development Issue
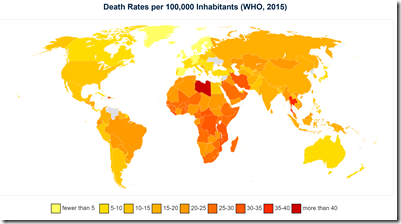
Low and middle-income countries (LMICs) suffer 90% of the 1.35 million road crash deaths and up to 50 million injuries occurring annually. It is the eight leading cause of death in the world (see below) [1]. Improving road safety is critical to the World Bank’s twin goals of eradicating extreme poverty and increasing shared prosperity. The United Nations ‘Sustainable Development Goal’ 3.6 sets a target of halving the injuries and deaths from road crashes.
Traffic crash deaths and injuries drive families into economic hardship, and in many cases poverty, when the family’s primary income earner is killed or suffers disability. In addition, crash deaths and injuries drain human capital and create costs which have been shown to significantly limit the economic growth of LMICs. Road transport generates 97% of deaths from all modes of transport[3]. Investments in road safety often are not capital intensive. They often amount to 1-5% of the capital costs for a project and yield positive benefit cost ratios.
As shown below, it is developing countries who suffer the most [2]. Countries in Africa and South-East Asia have regional rates of road fatalities higher than the global rate with 26.6 and 20.7 deaths per 100,000 population respectively. This is followed by countries in the Eastern Mediterranean and Western Pacific which have regional rates comparable with the global rate with 18 and 16.9 deaths per 100,000 population respectively. Countries in the Americas and Europe have the lowest regional rates of 15.6 and 9.3 deaths per 100,000 population respectively. The Americas, Europe and Western Pacific have seen rates decrease since 2013.
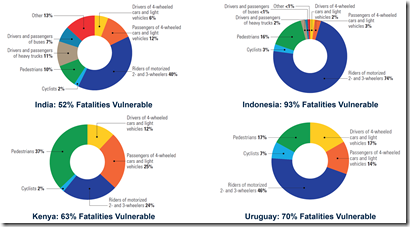
Vulnerable users require special considerations—and not just because I am a cyclist! Globally, pedestrians and cyclists represent 26% of all deaths, with those using motorized two- and three-wheelers comprising another 28%–i.e. 54%.
Africa has the highest proportion of pedestrian and cyclist mortalities, with 44% of deaths [1]. In South-East Asia and the Western Pacific, the majority of deaths are among riders of motorized two- and three-wheelers who represent 43% and 36% of all deaths respectively. The heavy burden of deaths born by vulnerable users is a reflection of infrastructure and vehicle design that prioritizes cars and other motorized transport. Vulnerable users still are largely ignored in the planning, design and operation of roads.
How bad can it be for vulnerable users in individual countries? As high as 93% of the fatalities are vulnerable users! [1]. Don’t let your friends or family driver motorcycles in places like Indonesia or Vietnam…
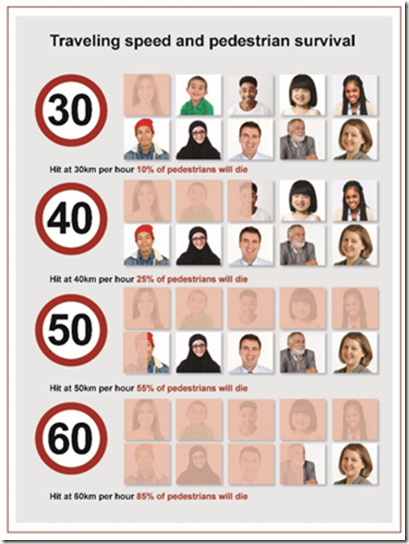
Speed is the number one reason why we have so many vulnerable users killed and injured. Each 1% increase in speed results in a 4% increase in deaths. It is simple kinetic energy: when a soft object (the vulnerable user) comes into contact with a harder object (the vehicle) the energy is transferred to the soft object. The figure below is an example of this. Striking a pedestrian at 30 km/h means they only have a 10% of death; at 65 km/h it’s 85%. Above 70 km/h, death is guaranteed …
Why Do Crashes Happen?
At the core it comes down to the inability of drivers to accurately assess and respond to risks. Claes Tingvall from Sweden developed the two figures below to illustrate this point … The left is how we perceive the situation; the right is the actual situation from a road safety risk perspective. If the pedestrian on the footpath wanders off to the right, they may be struck by a vehicle passing through the intersection; and they assume vehicles will stop at the light! We happily drive along a rural road which is 3 m wide with vehicles travelling at speed in the opposite direction so if we stray out of the lane the results are catastrophic. But how many of us would drive at 100 km/h on a 3 m wide bridge with no guardrails, and a 500 m drop off the side? Not many!
When I run road safety training courses I ask people to rate their driving skills from 0 to 10 (I am a 4 because I mainly cycle—15,000 km last year vs 4,000 km driving—so my life is generally 25 km/h), and the average is 7. Guess what? The average has to be 5 so most have a higher opinion of their skills than actually exists.
Now, this is not to say that issues like impaired and distracted driving don’t need to be considered, but even with these, if the risk was properly perceived it is argued that drivers would adapt appropriately. Just how risky is distracted driving? Below are some findings from Australia [4].
Texting is particularly problematic. Texting while driving is equivalent to driving when impaired by alcohol in terms of increased accident risk. This is a brilliant short video from Belgium which shows just how difficult it is. Driving students were told that they had to be able to text and drive to pass their driver’s test! Watch the mayhem which happens …
Road Safety in the World Bank’s Environmental and Social Framework
 In 2016 the World Bank adopted a new Environmental and Social Framework (ESF) to be implemented on new projects with ‘Concept Notes’ prepared after October 1, 2018. The ESF calls for road safety to be considered on projects.
This is a major shift for the World Bank—which hopefully other donors will also copy. While we had previously considered road safety on our transport projects, the new requirements of the ESF not only call for us to deepen these efforts, but it also expands the application of road safety to non-transport projects.
We have identified four types of projects where the ESF’s road safety provisions will have to apply:
- Type A – Transport: Transport projects with road construction or rehabilitation (e.g., highways, rural roads); urban transport projects (e.g., Bus Rapid Transit (BRT), metro); any project which leads to new or changed road infrastructure (e.g. through access roads) such as ports, railways and aviation infrastructure.
- Type B – Other: Transport (non-road infrastructure improvement related) and non-transport projects which change speeds, traffic mix or volume, vulnerable road user (pedestrians, bicyclists, motorcyclists) mix, volume, routes or facilities. Examples may include policy changes on speed limits or vehicle import regulations, or the opening of a facility which draws trucks or pedestrians, etc.;
- Type C – Construction Only: Projects with road safety impacts during construction only; and,
- Type D – Vehicle Procurements: Projects with vehicle procurements as the only influence on road safety (e.g. fleets or even project vehicles).
Within these four types of projects, we have three groups who are exposed to road safety risks: workers, communities, and road users. While traditionally we have tended to focus on road safety during construction, the reality is that facilities that we build will be open for decades and so it is the road users and local communities who will pay the greatest road safety cost.
What Can We Do To Improve Road Safety
The first step is to think differently. Over the last 20+ years road safety professionals have realized that our road safety goals will only be achieved through a holistic and systematic approach towards road safety, as embodied in the ‘Safe System’ approach. The Safe System approach embraces a zero-harm goal and places a strong emphasis on road builder/ operator and vehicle manufacturer accountability for road safety performance. The genesis of this approach can be found in the Swedish Vision Zero and Dutch Sustainable Safety strategies of two decades ago that set a long-term goal for the road system to be free of deaths and serious injuries. In a ‘Safe System’, safe means safe–not partially safe–such as in the well accepted, zero-harm requirement for workplace safety. The best way of thinking of this paradigm is illustrated below.
Fatalities and serious injuries (FSI) are the largest cost in crashes in all senses; and an emphasis on them sometimes results in different actions than arise when focusing only on reducing crashes. The focus of a Safe System is to eliminate, or at least reduce, FSIs, even though humans will still make errors and crashes may still occur. To put it bluntly, people should not be killed or seriously injured because they make a mistake while driving.
To achieve a Safe System, we consider four key areas: safe roads; safe speeds; safe vehicles, and safe people. The goal is to create a situation whereby in the inevitable event of a crash, the resultant energy does not lead to an FSI. Let me give a few examples of how we achieve this …
Safe Roads: After speeds, the provision of safe roads is the next best solution for road safety. There are a range of interventions available that can be implemented to make roads safer. For example, if you have a four way 80 km/h rural road intersection (see below), if there is collision between two vehicles it will be at a high speed and there is a 100% risk of an FSI for almost all of the 56 different conflict points. Replacing it with a roundabout means that at worse there is a 25% risk of FSI, and for most conflicts less than 10%. This is because a roundabout reduces the speed through the intersection. It should be noted that roundabouts lead to an increased number of crashes over a four way controlled intersection, but since these are at low speeds they are generally damage only and so the trade off is worth it. Of course if you have lots of pedestrians and/or cyclists there are other issues with roundabouts, but as a general rule they are preferable to cross intersections.
We also know that some roads are unsafe due to factors such as pedestrians walking along the edges, lack of centreline barriers, etc. The World Bank supported the development of the International Road Assessment Program (iRAP) which classifies roads from 1 to 5 stars. Below is an example of a 1 star vs 5 star road. The risk of an FSI is approximately halved with each increase in star rating [5]. As a general rule, we should aim for a minimum 3 star road quality on donor financed projects, although this is not always possible.
As a personal example of what can be done, I was responsible for preparing and implementing the Kiribati Road Rehabilitation Project in 2010. This saw the main two-lane road in Tarawa upgraded from a destroyed and flooded potholed road—where the condition constrained speeds—to one which would inevitably lead to higher speeds since people didn’t have to dodge the holes. To mitigate the increased risk, we put in 116 speed humps, 56.8 km of footpaths, 253 street lights, 181 bus stopping bays, and 595 road signs. In some areas we reduced the width to 6 m to both reduce the speeds (through increased roadside friction), and to provide more room for footpaths. The Implementation Completion Report [6] showed these improvements in use (see below). At the same time, the project undertook complementary work to improve enforcement through the provision of speed management equipment to the police, training, and enhanced road laws. Now, there will still be issues with road safety, but had we not made so many investments in safe roads it would have been far worse.
With the new ESF we have put in a series of considerations to help ensure that the infrastructure financed by the World Bank will be as safe as is practicable, given the level of road safety risk.
Safe Vehicles: At a personal level, one of the most important things that you can do is to ensure that you are driving a safe (and well maintained) vehicle. This means vehicles have:
- Seat belts
- Air bags
- Electronic stability control and automatic braking systems
- Have designs which protect drivers, riders, passengers and other road users in the event of a crash
The latest vehicles have features such as:
- Automatic emergency braking for vehicles and pedestrians
- Blind spot detection
- Lane departure warning
- Smart cruise control to manage speeds
The design and safety features of cars leads to quite different FSI outcomes. The figure below contrasts an NCAP 1 star car with a 5 star car. The NCAP star safety rating is determined from a series of vehicle tests that represent, in a simplified way, important real life accident scenarios that could result in and FSI for car occupants or other road users. The number of stars reflects how well the car performs and it is also influenced by what safety equipment the vehicle manufacturer is offering in each market. So a high number of stars shows not only that the test result was good, but also that safety equipment on the tested model is readily available. The star rating goes beyond the legal requirements. A car that just meets the minimum legal demands would not be eligible for any stars. This also means that a car which is rated poorly is not necessarily unsafe, but it is not as safe as its competitors that were rated better.
The five-star safety rating system continuously evolves as older technology matures and new innovations become available. Thus, a 2009 5 star vehicle would potentially be a 4 star vehicle in 2019.
The New Zealand Transport Agency (NZTA) did a great video on buying a cheap used car with minimal safety features—starring St John Ambulance staff as ‘sales people’. Yes, unsafe cars are cheap, but isn’t protecting your family worth paying a bit more? I was told that when they analysed who bought these cars, a sizeable number were from affluent areas where the parents decided to buy their children a cheap run around as they learned to drive. Young drivers need safer cars as they are inexperienced! Eighty-one percent of New Zealand’s young driver deaths and serious injuries have happened in a one or two-star safety-rated car. Even scarier is the fact that these cars make up 45% of the country’s vehicle fleet – approximately 1.49 million cars.
It was agreed as part of implementing the new ESF road safety standards, that the World Bank would only finance 4 or 5 star vehicles, if they are available. Otherwise, we will look at vehicles with the maximum number of UN standards available. This will at least ensure that our beneficiaries are in as safe vehicles as is practicable.
Safe Users: The safe users need to be considered: (i) during construction (both workers and people travelling through the site); and, (ii) during implementation once the road has opened. The latter is when most fatalities will arise. Our GPN work contains a series of interventions—again based on risk—to address both of these issues.
Tying it Together
The NZTA prepared a great video ‘The Difference Between Life and Death’ which shows how crashes can arise, and more importantly, how through a Safe System they can be addressed. Below is an excerpt from the video which in six minutes covers things brilliantly.
I’m grateful that as my time at the World Bank approaches its end, that I was able to be part of a team working on such an important issue. I hope that our efforts will have at least a modest impact on reducing this global catastrophe. A particular call out goes to Soames Jobs who provided the leadership for this effort. Was a privilege to work with him.
[1] World Health Organization: WHO (2018 and 2015) Global Status Report on Road Safety. WHO: Geneva.
[2] https://commons.wikimedia.org/w/index.php?curid=73917099.
[3] Sustainable Mobility for All (2017). http://www.sum4all.org/publications/global-mobility-report-2017.
[4] https://www.arrb.com.au/latest-research/driver-distraction-more-serious-than-you-think .


